I have a problem with a node. I'm new to this, it is my first and only node, so please consider that.
These are the entries from the log, notice the line Latest SOLID SUBTANGLE milestone has changed from #304458 to #304459
12/16 11:23:27.085 [pool-2-thread-2] INFO  com.iota.iri.network.Node - toProcess = 0 , toBroadcast = 0 , toRequest = 0 , toReply = 0 / totalTransactions = 6353064
12/16 11:23:37.087 [pool-2-thread-2] INFO  com.iota.iri.network.Node - toProcess = 0 , toBroadcast = 0 , toRequest = 0 , toReply = 0 / totalTransactions = 6353069
12/16 11:23:39.595 [Latest Milestone Tracker] INFO  com.iota.iri.Milestone - Latest milestone has changed from #304458 to #304459
12/16 11:23:41.318 [Solid Milestone Tracker] INFO  com.iota.iri.Milestone - Latest SOLID SUBTANGLE milestone has changed from #304458 to #304459
12/16 11:23:47.088 [pool-2-thread-2] INFO  com.iota.iri.network.Node - toProcess = 0 , toBroadcast = 0 , toRequest = 0 , toReply = 0 / totalTransactions = 6353072
12/16 11:23:57.091 [pool-2-thread-2] INFO  com.iota.iri.network.Node - toProcess = 0 , toBroadcast = 0 , toRequest = 0 , toReply = 0 / totalTransactions = 6353074
I'm outputting IRI MessageQ messages to a client which shows the following result, which also contains this line Latest SOLID SUBTANGLE milestone has changed from 304458 to 304459, indicating that it matches the server's log, and that tx's (for newly seen transactions) and sn's (newly confirmed transactions ( by solid milestone children measurement )) are occurring.
sn LVIMFQDQLLGUYSVZESMTF9TFMGS9IXEZFDBLUMEIHFLNPIJQURXEOWBDYOIMHAH9PJFAMEWHABKUA9999 OHAGBILSSXLAVQUDVUVRDSWQACLCCVQKKTTOHWLCYWAEADEIVIZQASILBZNDUHTNINYLIFHBLELQRDHTA (bundle)
sn CIOMIZIZJUXCMJODLYTNXNRXQRVYAXRVIHZ9CFN9FTWGNGOSIPUPYYRHQHPJHWHIBFMJDYPYVRZXZ9999 W9BZGAJNZPUDXWDQQXVLUKIFFUBOAGJBXGRER9FUZCRUQYN9GF9XFFWCGSL9DPVP9RALEIIHBPKJTSR9X (bundle)
sn BLXQHNBOSYQ9A9NQXJRGCGWPGKRIHPSTKVEBAVGFRNTDG9GGHDVXDCJWEJTINE9ZLKZJMLZHMQPW99999 W9BZGAJNZPUDXWDQQXVLUKIFFUBOAGJBXGRER9FUZCRUQYN9GF9XFFWCGSL9DPVP9RALEIIHBPKJTSR9X (bundle)
sn PKGLEOT9QDQCFLMKCLWLALHEGOAJNMSBMITQULIMDHZHM9QHEMRPPGCBEMVRYYZEBGAC9MPICTGV99999 W9BZGAJNZPUDXWDQQXVLUKIFFUBOAGJBXGRER9FUZCRUQYN9GF9XFFWCGSL9DPVP9RALEIIHBPKJTSR9X (bundle)
sn IKCGKVMDNFSAKEPUWKPCVRBOQGLNCUKQLBOFWEOYAVXQHHMRHSSFVOHG9FZ9GSXN9DAOOPMYWFPT99999 W9BZGAJNZPUDXWDQQXVLUKIFFUBOAGJBXGRER9FUZCRUQYN9GF9XFFWCGSL9DPVP9RALEIIHBPKJTSR9X (bundle)
lmsi --- Latest SOLID SUBTANGLE milestone has changed from 304458 to 304459
lmhs --- 9IZVMIXDTT9ZEDM9WEMBMUGUWRURFJLUYCJNVSJVBULIGMTMTGRPNQAHOYCEEKYMGCOVEDJ9KYOCA9999
tx BGTFQGHAUGMOOMZEWVSK9BDOPVNXZOWCTNAVQCXPWRAXD9KUYSXDOWNWHJGZKFBFTAPKSEEWDDA999999 MORSELZMJGIQRQPXACAGNDPCIFU an hour ago
tx FLHOZJTGCGTKYRATXBFAILY9OOAOQX9RVGWWQDYIBGKWIYXVGTPBZKBQFQRMYYOON9TTCXB9B9XNA9999 KF9999999999999999999999999 2 minutes ago
tx IIQOXFORBYHZPFHJSYTCXYLZUIB9FWJOJDHXOBUEAD9TUCAPAVWKM9QOLKVUKNUHGHBOECJQAJBYZ9999 TSA9WONKYTONKYSPAM999999999 seconds ago
rstat --- toProcess = 0 , toBroadcast = 0 , toRequest = 0 , toReply = 0 , totalTransactions = 6353072
tx BVIFRMXMIEZQJLPITNZSSZKPJWIUNBCKRVKJZBSVCFWAV9BNKQKNYDF9COYERKMHQZQUNTHOCRLIZ9999 WNRSELZMJGIQRQPXACAGNDPCIFU 21 minutes ago
tx JYBHYLXUINGEYLGYBMFMTWMDQTGFYZUIEMWXIUCBUWAMEJLOAQMNUTYNICEUJCDUUBFXZMAREVE999999 LETHREENAMEMAREKTICHY999999 32 minutes ago
rstat --- toProcess = 0 , toBroadcast = 0 , toRequest = 0 , toReply = 0 , totalTransactions = 6353074
This node is only showing values for toRequest, all other to-fields are always 0, totalTransactions increases.
When issuing an sudo tcpdump -i docker0 host 172.17.0.12 and port 14265 (the node is in a Docker container at IP 172.17.0.12, the UDP receive port of the node is 14265) I get tons of the following results
12:37:46.133162 IP __NEIGHBOR_.14600 > 172.17.0.12.14265: UDP, bad length 1650 > 1368
12:37:46.156524 IP __NEIGHBOR_.14600 > 172.17.0.12.14265: UDP, bad length 1650 > 1368
12:37:46.175273 IP __NEIGHBOR_.14600 > 172.17.0.12.14265: UDP, bad length 1650 > 1368
12:37:46.193612 IP __NEIGHBOR_.14600 > 172.17.0.12.14265: UDP, bad length 1650 > 1368
12:37:46.199761 IP 172.17.0.12.14265 > __NEIGHBOR_.14600: UDP, length 1650
12:37:46.220227 IP __NEIGHBOR_.14600 > 172.17.0.12.14265: UDP, bad length 1650 > 1368
12:37:46.226090 IP 172.17.0.12.14265 > __NEIGHBOR_.14600: UDP, length 1650
12:37:46.243084 IP __NEIGHBOR_.14600 > 172.17.0.12.14265: UDP, bad length 1650 > 1368
12:37:46.247875 IP 172.17.0.12.14265 > __NEIGHBOR_.14600: UDP, length 1650
I downloaded the database yesterday at around 7pm UTC, and it's been running since then
api.get_node_info() contains the following, which looks ok:
u'latestMilestone': TransactionHash('EGABTYPTCMZTPPAOHMJJUZHAIXTQYVQLMVWCURZJIRN9YOMETFDBQCZIFTENNNVFTXKQNTCDHEIBZ9999'),
u'latestMilestoneIndex': 304471,
u'latestSolidSubtangleMilestone': TransactionHash('EGABTYPTCMZTPPAOHMJJUZHAIXTQYVQLMVWCURZJIRN9YOMETFDBQCZIFTENNNVFTXKQNTCDHEIBZ9999'),
u'latestSolidSubtangleMilestoneIndex': 304471,
u'neighbors': 5,
Can someone explain me what is occurring? Is the node working? In the IRI MessageQ the tx and sn's seem to indicating that yes, but I only have toProcess = 0 , toBroadcast = 0 , toRequest = (usually >0) , toReply = 0 in the logs.
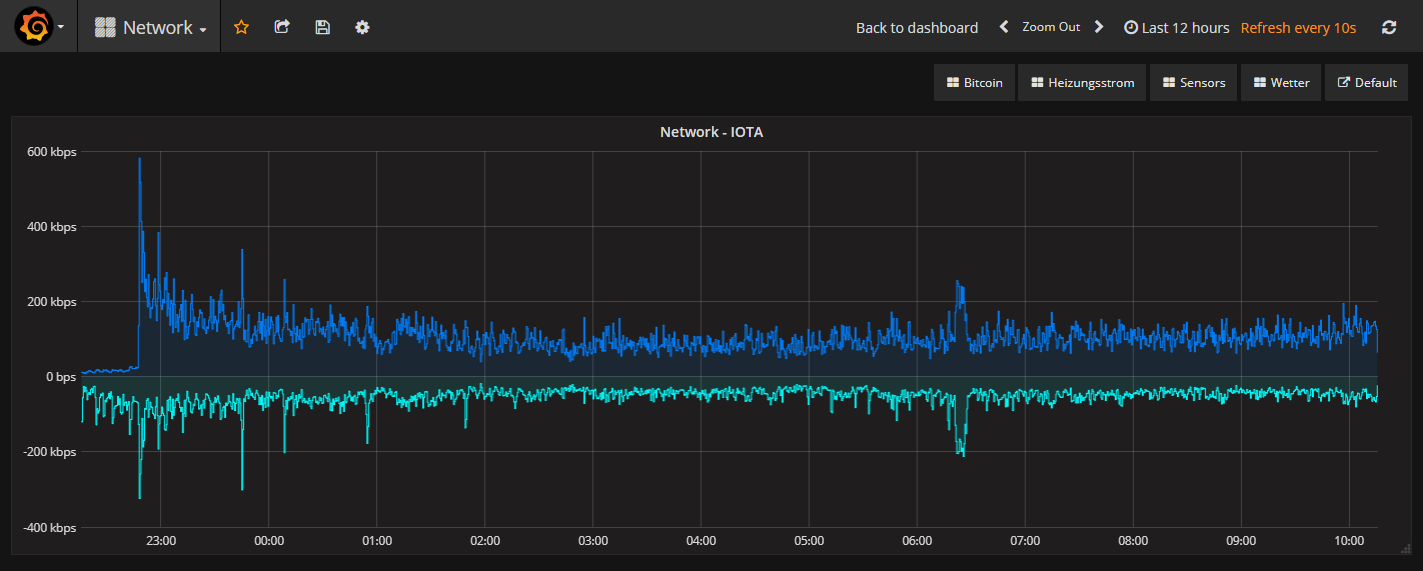
This is the traffic for the node, with 7 neighbors (I noticed that the graph must be horizontally flipped, what you see in the image has outgoung traffic as positive and incoming as negative)
And this is what getNeighbors returns after 17 hours of node uptime
 0: REDACTED_IP|14600  all 1048    inv 0   new 1       req 640     snt 55230
 1: REDACTED_IP|14600  all 2708    inv 0   new 0       req 1625    snt 56212
 2: REDACTED_IP|41041  all 945     inv 0   new 3       req 524     snt 54961
 3: REDACTED_IP|14600  all 28475   inv 0   new 200     req 1041    snt 66363
 4: REDACTED_IP|14600  all 114355  inv 0   new 45495   req 14729   snt 96817
 5: REDACTED_IP|14600  all 65395   inv 0   new 1029    req 7439    snt 65703
 6: REDACTED_IP|14600  all 37527   inv 0   new 277     req 4664    snt 72680
 7: REDACTED_IP|14600  all 8548    inv 0   new 0       req 5660    snt 59584
